Custom Used vehicle management software for dealerships and traders
We need an application that allows us to track daily stock of cars and see statistics so that managing used car stock becomes easier. All examples on the market that seen like Fastback are good but unusable in our case because we have several companies in group than extra fields which in Fastback are impossible and the price is high for the future and thousands of cars. The price per year is about the same price as development for us, we will prepare what we need in 1 month. With backup is also in problem with such providers. So whether we like it or not, we had to develop our own. We just start with Django framwork and extend it if necessary.
Framework used for server side Django with admin interface and inline forms.
Framework used for server side Django with admin interface and inline forms.
Then Dashboard build with
https://tailwindui.com/
https://alpinejs.dev/components#components
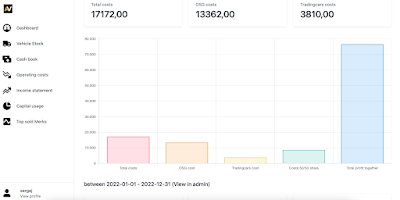
Charts
https://www.chartjs.org/docs/latest/charts/area.html https://www.chartjs.org/docs/latest/charts/doughnut.html
Charts views for six sigma Analyse
Six Sigma is a method that provides organizations tools to improve the capability of their business processes. This increase in performance and decrease in process variation helps lead to defect reduction and improvement in profits, employee morale, and quality of products or services.
For example costs view
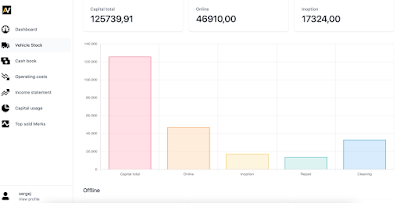
Capital usage
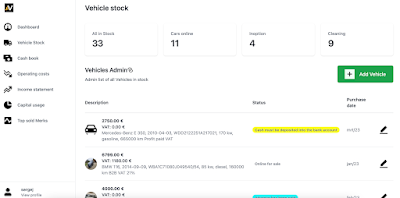
Stock
..
In this way we have gained a reasonable overview of business and control over income and costs.
Stock
..
In this way we have gained a reasonable overview of business and control over income and costs.
We need a home screen that will work as a Dashboard. That is a separate application. With which we first check which user is logged in.
So I first built up all the necessary models
Then all calculations built into models.
Calculations brainstorming
8000 - 4123 - 165 = 3712. Profit = Capital + VAT difference payable ( Sales VAT - Purchase VAT )
3712 - ( 200 + 50 + 200 + 80 ) = 3712 - 530 = 3199 / 2 = 1599 Subtracting costs of a car to calculate net profit 50% is for me.
So 4123 + 1599 = 5722 while I received 5999 on the bill for this car and as a result 278 Euro more.
Calculate in a different way because sometimes it leaves with a barrel sometimes without a barrel.
To ensure that healthy amounts remain in business, we include VAT in capital.
So formula of a Renault traffic looks something like this.
8000 - ( 4123.23 + 876.77 ) = 8000 - 5000 = 3000 Amount sold including sales “VAT” and cash received Min Full capital including VAT
result = Self.sale_price_real - (self.purchase_price + self.purchase_vat)
3000 - ( 200 + 50 + 200 + 80) = 3000 - 530 = 2470/2 = 1235 Profit minus costs 50/50
self.profit_total = (result - self.get_related_costs())/2
self.profit_total In order not to overwrite my already created and saved field we are going to store everything in profit_total otherwise we will overwrite data that we moved from EXEL..
profit_cash we will note already received cash. And use another status “All received…” This is used to indicate a car that has been sold and all cash payments and transfers have already been paid. In fact, we can note cash and link a car in this table so that we do not have information in stock but note it in the right place. Or note it back and forth, we will see how to do it in practice.
Profit in cash = 1235
Calculated Cash Profit
5000 + 1235 = 6235
profit cash = (Purchase price + Purchase vat + Profit total) - (Sale price + 876.77)
On the account 6000 via account (on invoice)
235 to be received in cash.. (Normally)
So I need to calculate and show it all in object.. In not editable fields..
So another field has to come to receive cash..
After all the calculations are built in I need to add more chart for visual representation of our performance so that this business can be made.
Comments
Post a Comment